Do you have any idea, what graphic is that? That is Indonesia’s total export in $ billion from 2000 – 2008. Do you see the sharp increase?
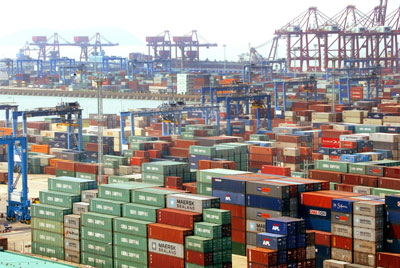
Do you know the figures? Here we go :
|
Year |
$ billion |
|
2000 |
48 |
|
2001 |
64.7 |
|
2002 |
56.5 |
|
2003 |
52.3 |
|
2004 |
64 |
|
005 |
69.84 |
|
2006 |
83.64 |
|
2007 |
102.23 |
|
2008 |
118.4 |
I am sure, with a more serious effort, Indonesia’s export can reach $300 billion in 2015. Go Indonesia!
Source : here
Popularity: 3% [?]
Posted on June 23rd, 2009 at 4:31 pm by Ian
0